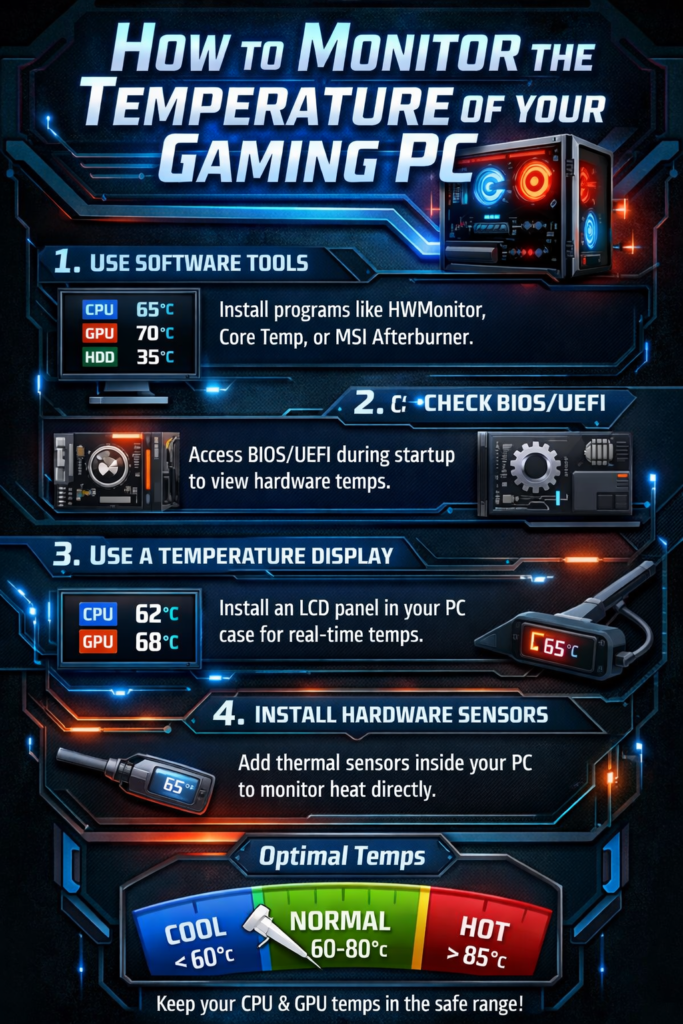
You’re in the middle of an intense game, your PC fans are whirring like a turbine, and the question pops into your head: is it overheating? It’s a very common concern. Learning to monitor your gaming PC ‘s temperature is one of the most important things you can do to protect your investment and ensure peak performance.

Don’t worry, you don’t need to be a computer expert. We’re going to show you several super easy and free methods so you can monitor the temperatures of your processor (CPU) and graphics card (GPU), both at idle and under load.
The Best Ways to Measure Your PC’s Temperature
Using Task Manager
- Open Task Manager (you can use the shortcut Ctrl + Shift + Esc ).
- Go to the “ Performance ” tab .
- In the left-hand column, find your GPU . Selecting it will show you its current temperature.
Note that this method is very practical, but it will only show you the temperature of the graphics card, not the processor.
With HWMonitor
To get a complete and detailed overview of your entire system at a glance, this is our favorite free tool.
In our experience, HWMonitor is like your PC’s control panel. Simply download and run it (no complex installation required), and it will instantly display the minimum, maximum, and current temperatures of your CPU, GPU, motherboard, hard drives, and more. It’s the easiest way to get a complete diagnostic.
For Gamers: MSI Afterburner
This is the tool you need if you want to see real-time temperatures overlaid on your game screen.
MSI Afterburner is a powerful program that, along with RivaTuner (which installs with it), lets you configure an on-screen overlay. You can customize it to display CPU and GPU temperature and usage, FPS, and much more, all without leaving the game. It’s the ultimate tool for monitoring performance in the heat of the moment.
From the BIOS/UEFI
-
- Restart your PC .
- Press the key indicated on the initial screen to enter the BIOS/UEFI (usually it is Delete, F2, F12 or Esc ).
- Look for a section called “Monitor” , “Hardware Monitor” or “PC Health Status” to view the CPU temperature and other sensors.
Other Useful Methods
- Your GPU software (NVIDIA/AMD): Both NVIDIA’s GeForce Experience (using the Alt+Z shortcut) and AMD’s Adrenalin software have their own options for displaying a performance overlay in-game. They are excellent alternatives to MSI Afterburner and come pre-installed with your graphics card drivers.
- From the BIOS/UEFI: After restarting your PC and entering the BIOS (usually by pressing F2, Delete, or F12), you can view the CPU’s idle temperature. This is useful for diagnosing overheating problems even when the PC is not performing any tasks.
- Core Temp: If your main concern is the processor, Core Temp is fantastic. It’s super lightweight and specializes in the CPU, showing the temperature of each core individually. It even has a plugin to view temperatures from your mobile device!
Why Does Your PC Overheat and Why Should You Care?
Your computer’s components, such as the processor and graphics card, consume energy to function. However, they aren’t 100% efficient, and all the energy not used for calculations is converted into heat. If that heat isn’t dissipated properly, problems begin.
Keeping temperatures under control is vital to avoid the dreaded thermal throttling . This is a safety mechanism: when a component gets too hot, it automatically reduces its speed to protect itself, causing sudden FPS drops and lag in the game.
Symptoms of an overheating computer
- Fans at full speed: If the fans constantly sound like they are about to take off, even during light tasks, it’s a sign that they are struggling to dissipate heat.
- Slowness and FPS drops: Does the game start well but then become slow and choppy after a while? That’s a classic symptom of thermal throttling.
- Unexpected restarts or shutdowns: This is the ultimate defense mechanism. If your PC suddenly shuts down while you’re playing, it’s very likely to prevent damage from overheating.
- Blue screens or crashes: System instability, such as the famous blue screens of death (BSOD), can also be caused by excessive temperature.
Ideal Temperatures for a Gaming PC
| Component | At Rest (Desk) | Under Load (Playing) | Danger Limit |
|---|---|---|---|
| CPU | Less than 50 °C | 70-85 °C | Over 95 °C |
| GPU | Less than 55 °C | 70-85 °C | Over 90 °C |
Ideally, your components should stay below 85°C while you’re gaming. If they exceed 90-95°C, you’ll likely start to notice performance drops.
What do I do if the temperatures are too high?
If you notice consistently high temperatures on your CPU or GPU, don’t panic. It’s usually a cooling issue that can be fixed. It could indicate that the fans are clogged with dust, or, if your PC is older, that the processor’s thermal paste has dried out and needs replacing.
To confirm if your system is stable under heavy load, you can use a stress test program like Prime95 for the CPU. Run it for about 15-30 minutes while monitoring the temperatures to see the maximum point your system reaches. If it approaches dangerous limits, it’s a clear sign that you need to improve your cooling.
Which Program Is Best for You?
As you’ve seen, monitoring your gaming PC’s temperature is easy, and you have many free tools at your disposal. The choice depends on your needs:
- For a quick and complete check, we recommend HWMonitor .
- To monitor temperatures while gaming, MSI Afterburner is king.
Monitoring temperatures will not only help you detect problems, but it will also allow you to enjoy your games at peak performance. Your gaming PC will thank you!
